
Monitor your grid services EVSEs and activations in Hub
See which of your EVSEs take part in grid services, where they are, and what happened during each grid event.
Updated 2 November 2026
This article is for operators enrolled in a grid services programme. You will find your EVSEs in the list or on a map, and check what happened during a grid event.
Before you start
The Grid services tab isn't available yet. The Activations view needs to be turned on separately.
Open grid services
- In the Hub menu, select CPO / Network, then Energy management.
- Select the Grid services tab.
The tab opens on EVSEs. If Activations is turned on for you, it appears next to it.
Find your EVSEs
The EVSEs view lists your EVSEs that take part in grid services. Use Search to narrow the list.
The list shows these columns:
- EVSE, Brand, Model and Max kW
- City, Country and Bidding zone
- Grid partner, Meter ID and Status
See where your EVSEs are
-
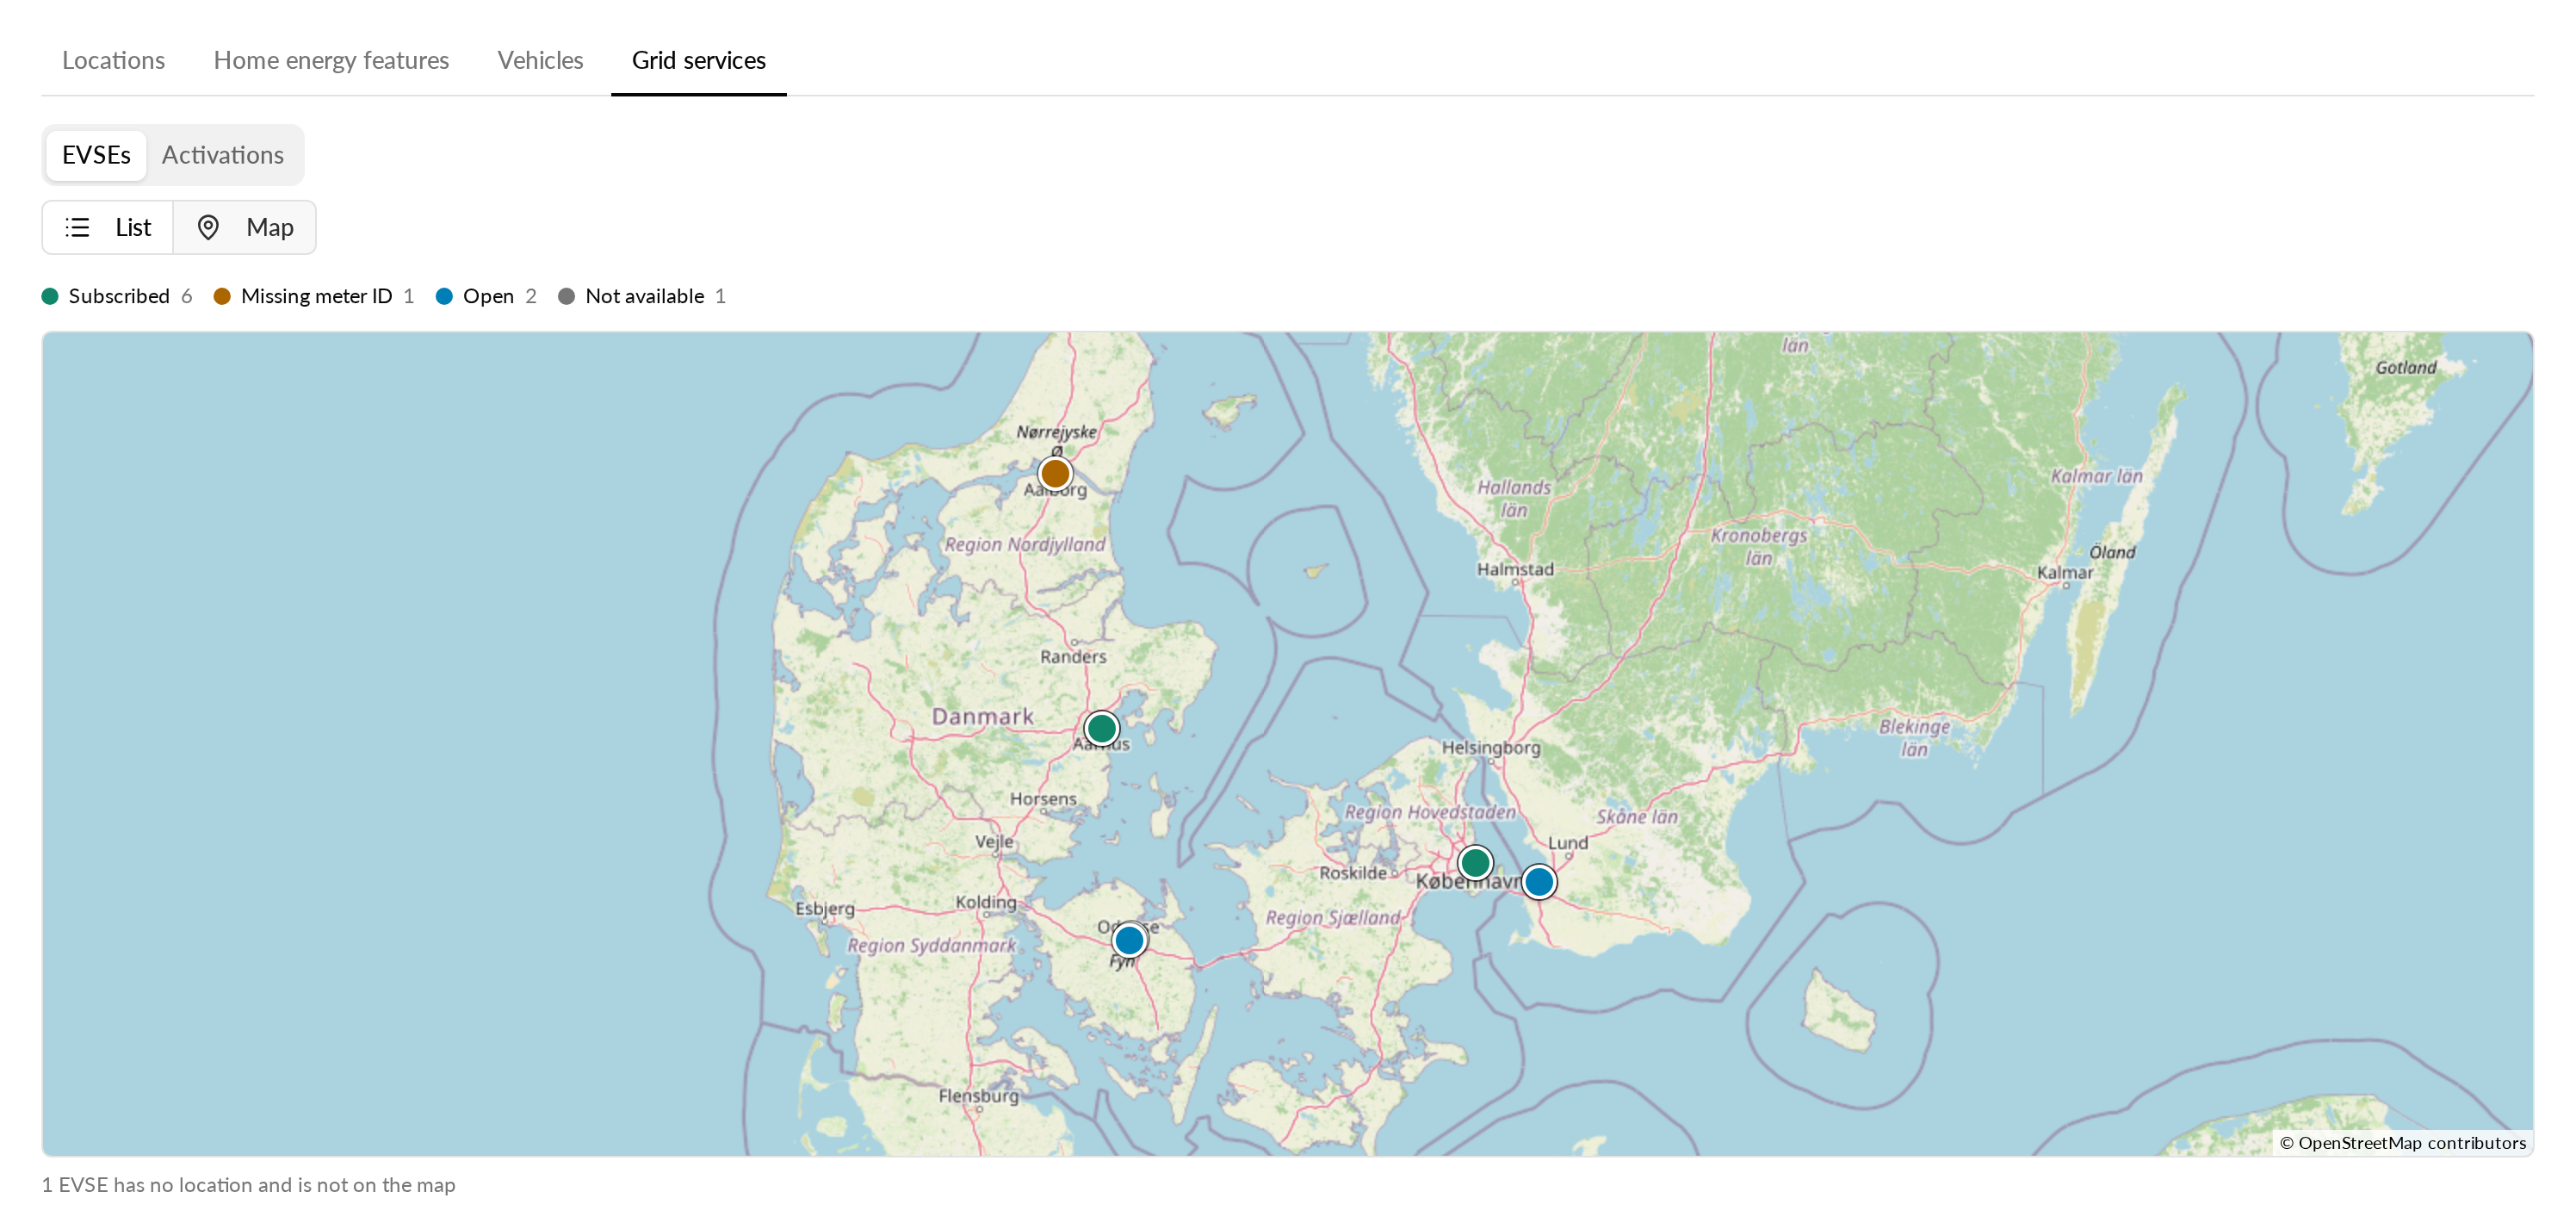
Above the list, select Map.
-
Select a pin to see the EVSE name and its grid status.
-
Select List to go back to the table.
Pin colours show the grid status:
| Colour | Legend label | Meaning |
|---|---|---|
| Green | Subscribed | The EVSE takes part in grid services. |
| Amber | Missing meter ID | The EVSE is subscribed but has no meter ID. |
| Blue | Open | The EVSE can still be enrolled. |
| Grey | Not available | The EVSE is closed or its status is unknown. |
EVSEs without a location are not on the map. A note under the map shows how many there are. The map shows up to 1,000 EVSEs.
Check what happened during a grid event
The Activations view lists every command your grid partner sent to your EVSEs: Curtail, Pause and Resume.
- Select the Activations view.
- Select Pick a time range, or choose a preset such as Last 24h or Last 7 days.
- Read the chart. It shows activations per time bucket. The footer shows the bucket size and the time zone.
- Use the Grid partner filter to show one partner only.
- Select Export CSV to download the activations in the range.
The cards above the chart show the number of activations and EVSEs affected. One EVSE that receives three commands counts once in EVSEs affected.
The table lists each activation with its start time, action, EVSE, partner, connector and latency. Latency is the time the signal took to reach Monta.
Open the timeline for one EVSE
- In the table, select the EVSE.
- Read the power chart and the list of events under it.
- Select Back to overview to return.
You can also select Open activation timeline in a pin on the map.