
Find your analytics in the new Studio dashboards
Learn how the Dashboards page in Monta Hub now opens Studio dashboards, where the old embedded panels moved, and how to switch back to the classic page.
Updated 2 November 2026
This article is for operator admins who analyze their network in Monta Hub. It shows where the old embedded dashboards moved and how to switch back to the classic page if you still need it.
Monta Hub is replacing the embedded analytics dashboards with Studio dashboards. Studio dashboards can be filtered, exported per widget, shared and cloned.
What you need
- Permission to manage the operator.
If you don't see the new Dashboards page, you may not have permission to manage the operator, or you may have switched back to the classic dashboards. In both cases you see the classic Dashboards page.
What changes
When the new experience is on for you:
- Dashboards opens the Studio dashboards list. It shows Monta's curated dashboards and your own.
- You can search, filter by owner, and switch between table and card views.
- You can create a dashboard with New or Generate with AI.
- Studio no longer appears separately under Admin > Developers. Existing links to Studio keep working.
Open the Dashboards page
- In the Hub sidebar, open Analytics.
- Select Dashboards.
- Select a dashboard to open it in the Studio viewer.
The breadcrumb in the viewer leads back to Dashboards.
Where the embedded panels moved
Some pages used to show embedded panels. They now link to the Studio dashboard that covers the same data.
| Page | What you see now |
|---|---|
| Network | The Insights tab is gone. The EVSEs tab replaces the charge point panels. The Site utilization tab replaces the site utilization panel. Each tab opens its dashboard in Studio. |
| Charging sessions > Insights | One card per dashboard: Operator overview, Failed charges and Roaming — Inbound. Each card opens its dashboard. |
| Payment & billing > Invoices | The Your invoices tab shows the invoices table. The All invoices tab opens the Invoices dashboard in Studio. |
A link to the old Insights tab opens the EVSE list. A link to the old All invoices view opens Your invoices.
The All invoices tab appears only if the Invoices dashboard is available to you. You need the permission to view the operator's invoices.
Switch back to the classic dashboards
If the classic page has something you still need, you can go back to it.
-
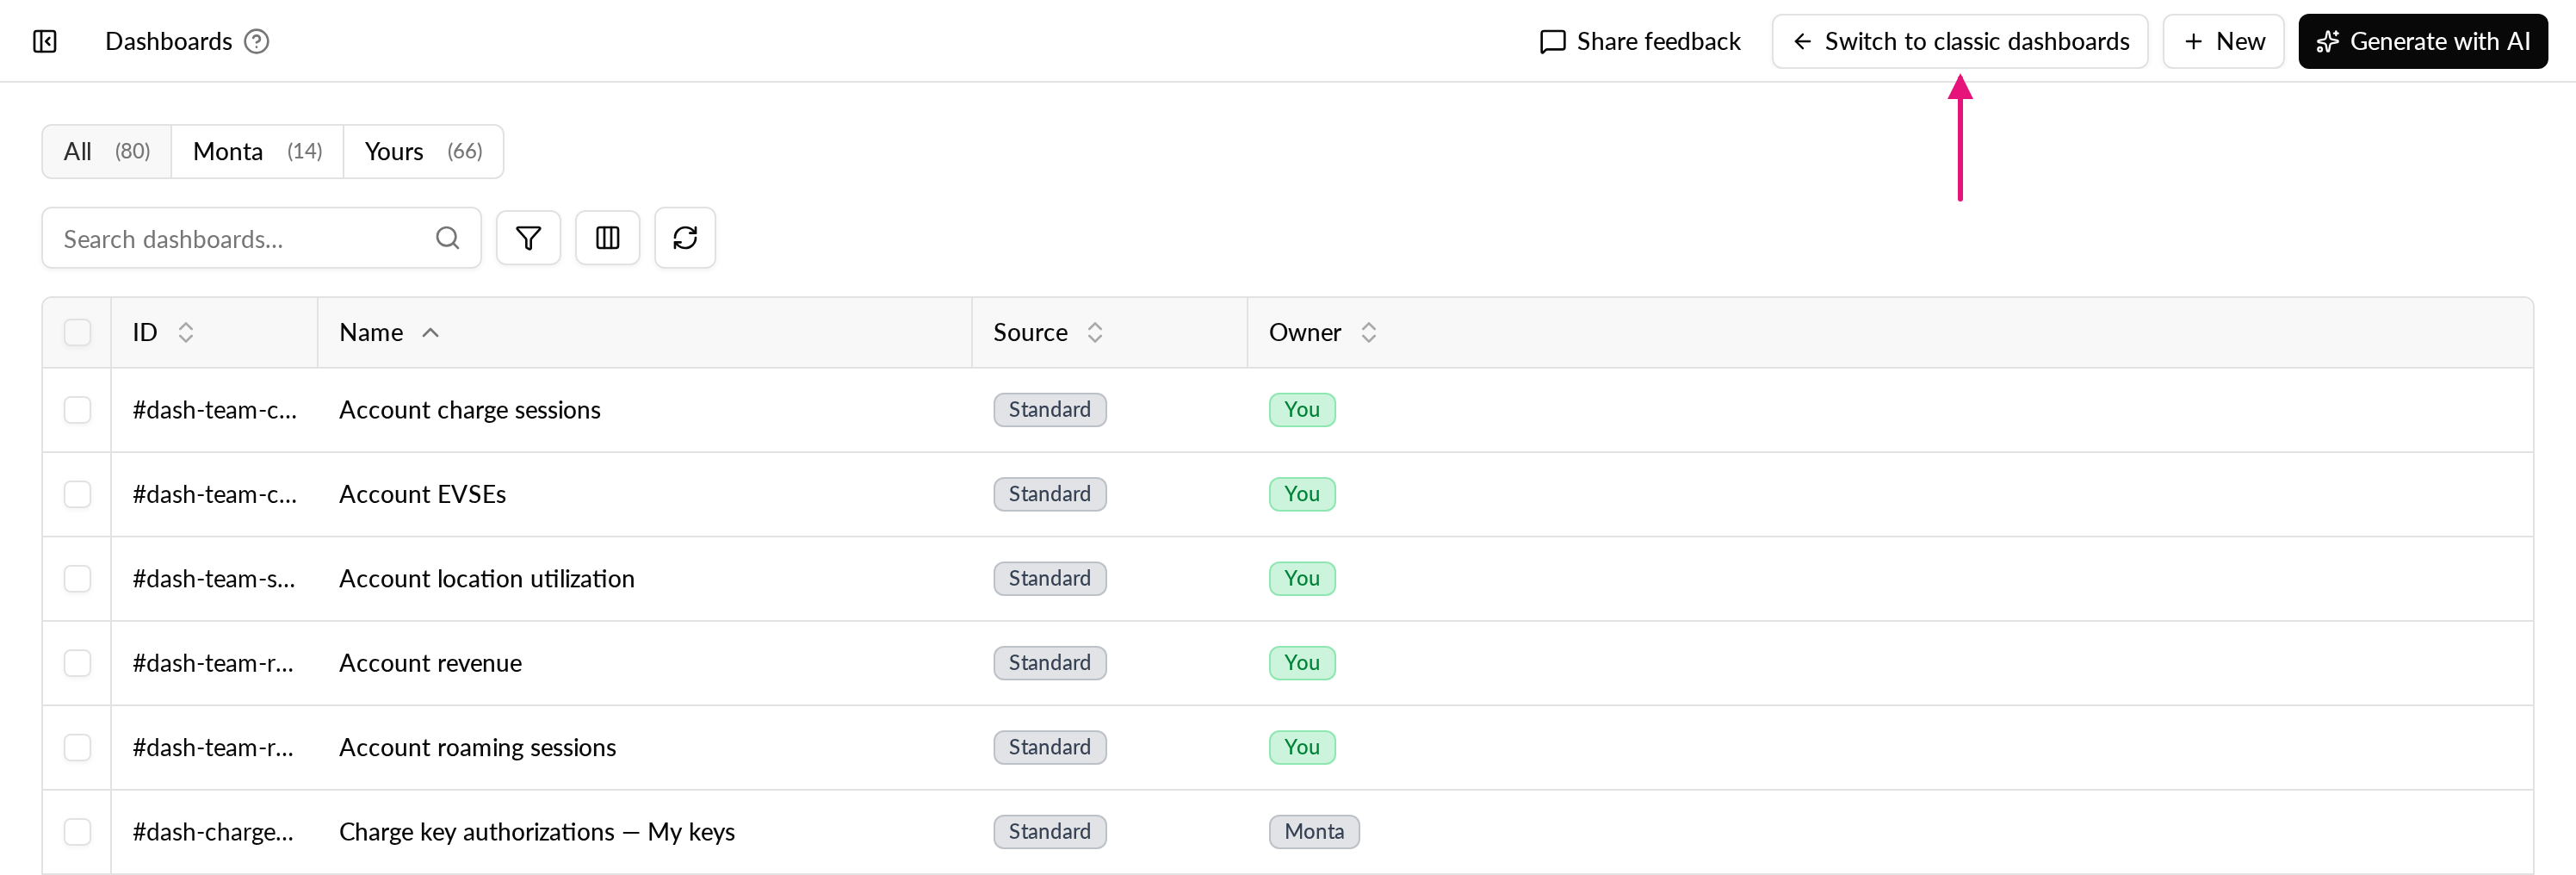
On the Dashboards page, select Switch to classic dashboards.
-
Optional: describe what is missing from the new dashboards.
-
Select Switch back.
You can leave the text field empty and still switch. Press Escape or click outside the prompt to close it without switching.
After you switch:
- Dashboards shows the classic page, with the dashboard selector, the Control Tower and the embedded analytics dashboards.
- The Insights tab on Network and the invoices toggle return.
- Studio is back under Admin > Developers.
Your choice belongs to you, not to the operator. It follows you across operators and devices.
Return to the new dashboards
On the classic page, select Try the new dashboards. No prompt appears.
For more on viewing and editing dashboards, see How do I view and edit dashboards in Monta Hub?.